CashQuil: the complete guide to the product
CashQuil is a web app for building financial models for SaaS and subscription businesses. Instead of assembling yet another sprawling spreadsheet, you fill in structured forms for revenue, costs, headcount, assets, and debt, and the service computes the P&L, the cash flow statement, unit-economics metrics, and investment indicators (NPV, IRR, PI, payback) for you. The output is a set of reports, charts, and exports you would not be embarrassed to hand to an investor or a CFO.
This article is a step-by-step tour of the product: from registration and the first run of the Setup Wizard through to exporting reports and choosing a plan. It is written for startup founders, product managers, and finance analysts who have just signed up and want to get their first model in place.
Introduction: what CashQuil is and the problem it solves
A typical SaaS financial model lives in Google Sheets and consists of a dozen tabs wired together by formulas that nobody remembers by the fifth iteration. CashQuil replaces those spreadsheets with an interactive editor: you enter drivers (traffic, conversion, pricing, retention, payroll) and the calculation engine recomputes the whole funnel, MRR, P&L, and cash flow on every edit, over a horizon of up to 120 months.
Who benefits from it:
- The founder preparing a model for a funding round who does not want to spend weeks gluing Excel together.
- The product manager who needs to test a hypothesis about a new plan or a change in pricing structure.
- The finance analyst who wants a stable environment with versioned scenarios and predictable math.
The service does not try to replace an ERP or an accounting system. It addresses one narrow but painful task: turning business assumptions into a defensible financial model.
Registration and activation
The entry point is the /login page. It offers two modes: sign in (Sign In) and registration (Create account). The toggle button sits at the bottom of the card.
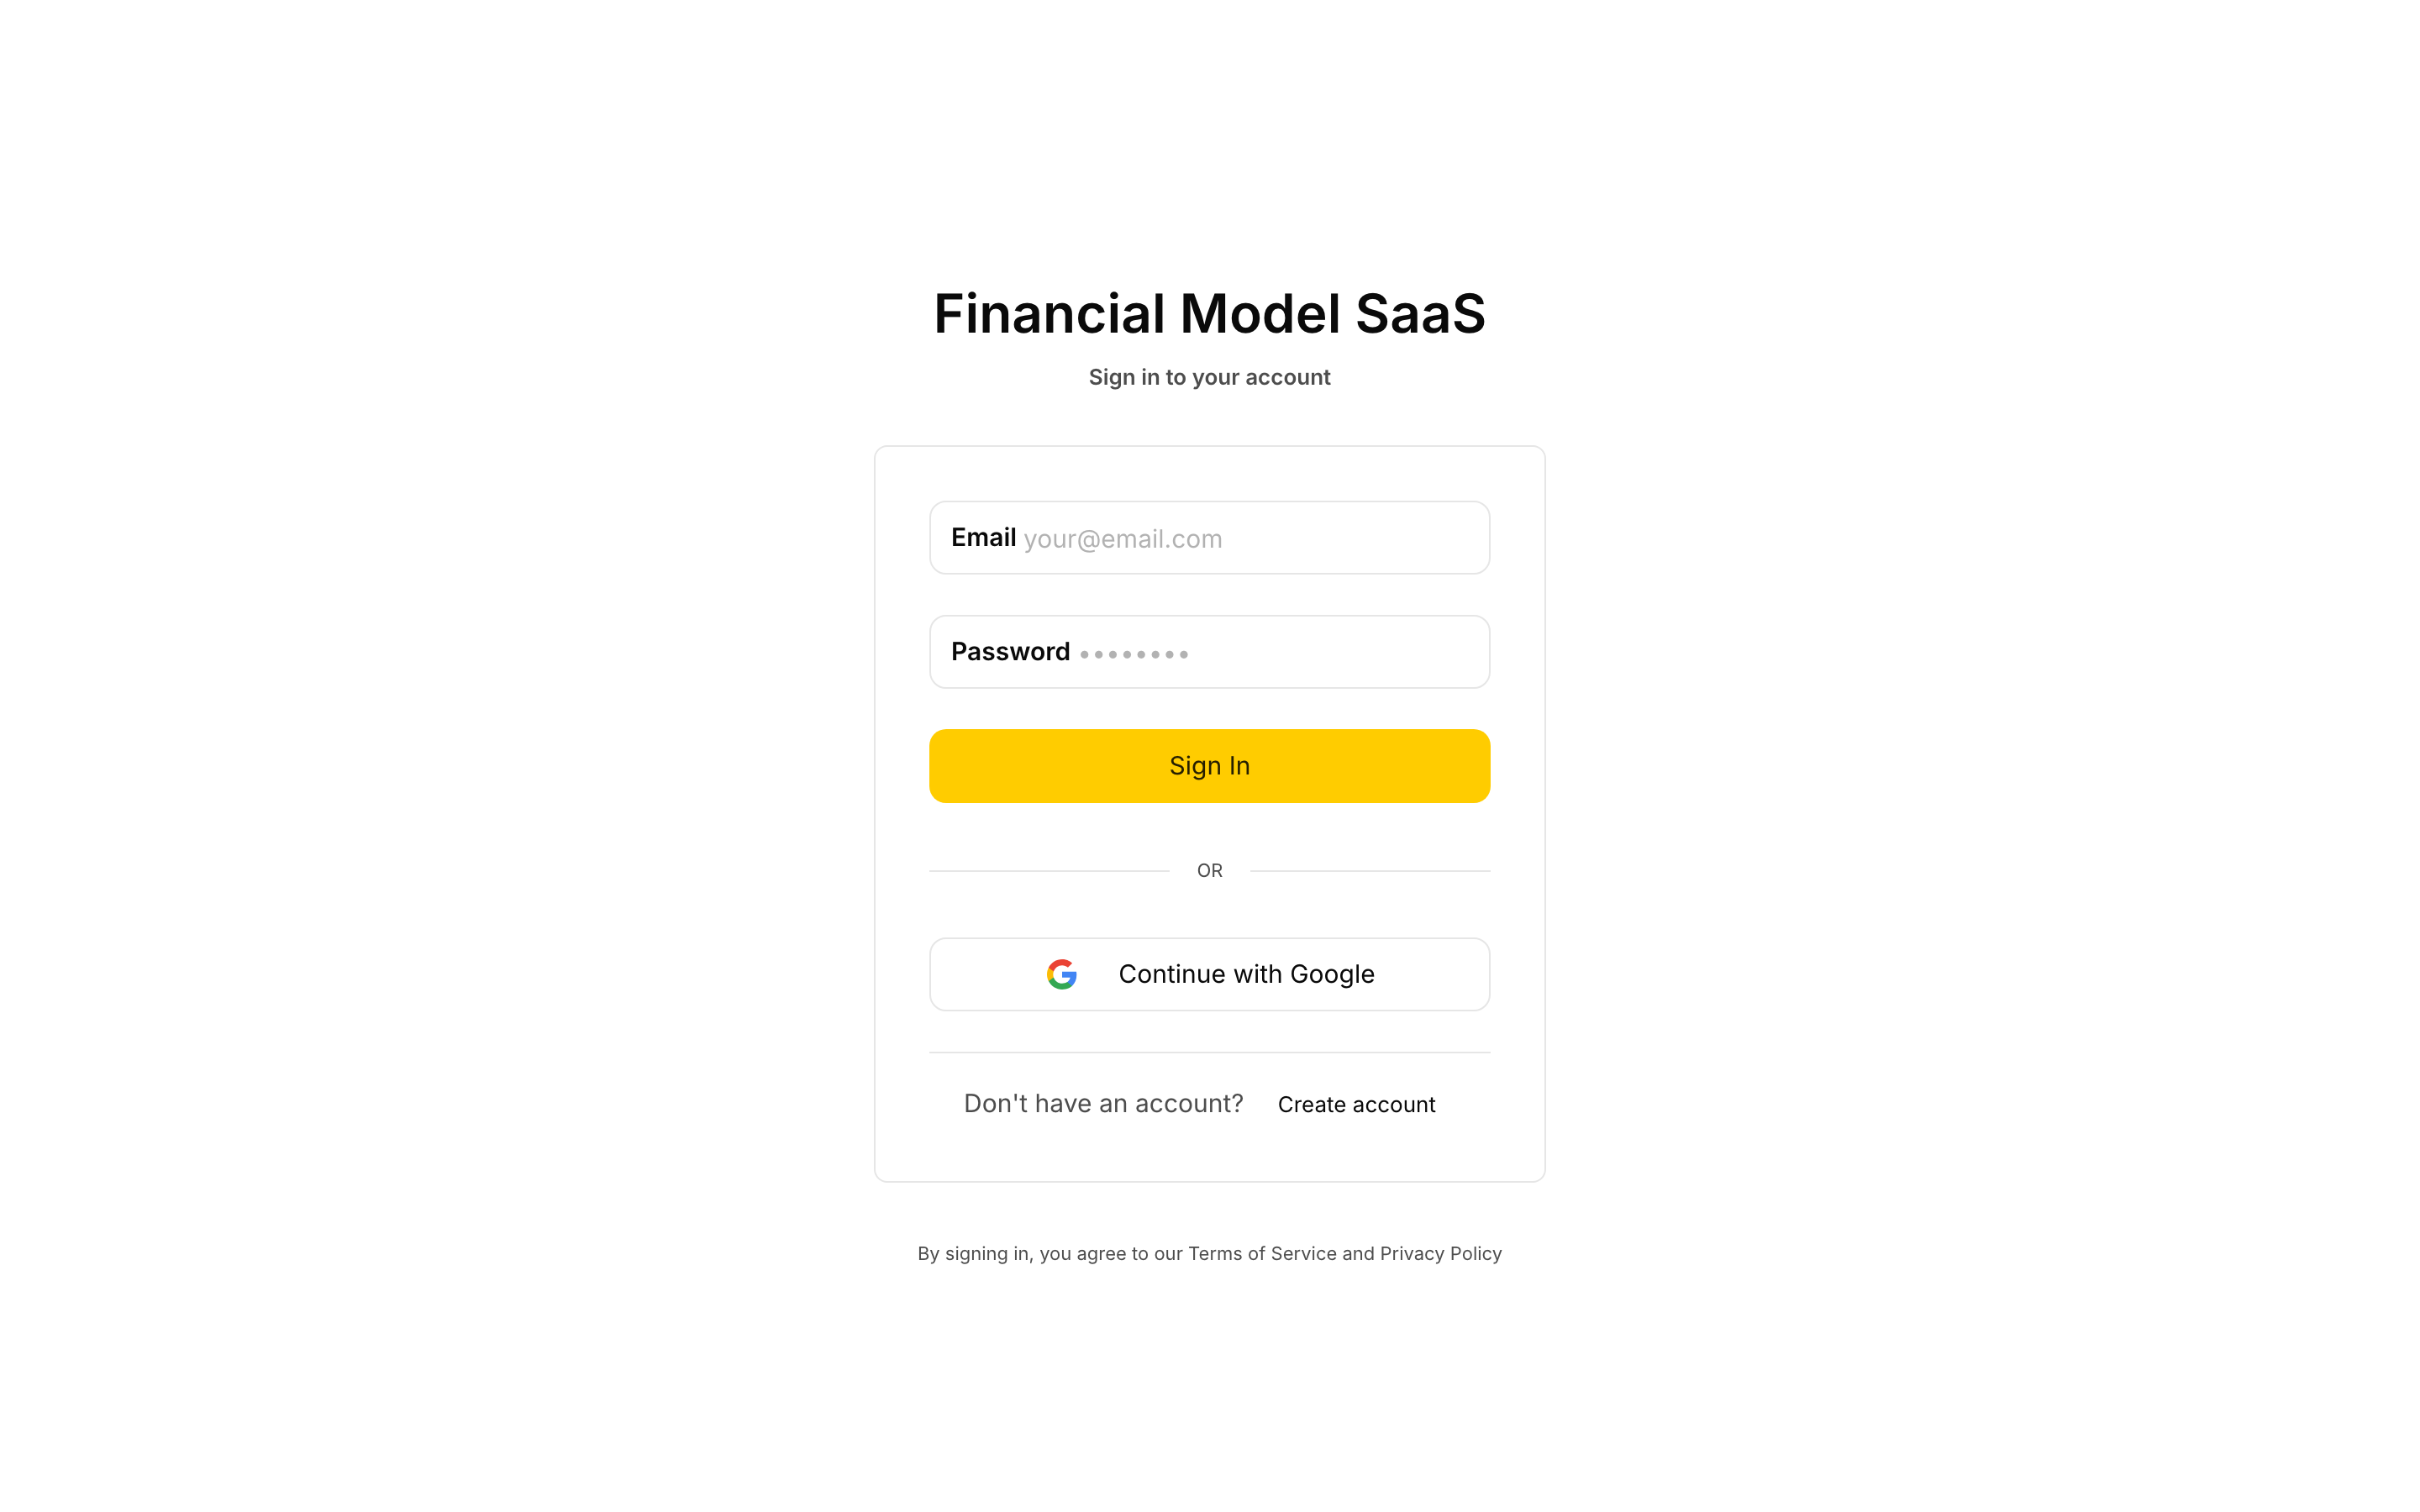
To register:
- On the
/loginpage, click Create account. - Enter your email, a password (at least 8 characters), and optionally a Display Name.
- Click Register. After a successful registration you will see the message "Registration successful! Please check your email for the activation link."
- Open the email and follow the link, which looks like
/activate?token=.... It leads to the ActivationPage, which calls the/auth/activateendpoint and shows the result—either Account Activated! or Activation Failed, with the option to request a new link. - Once activated, return to
/loginand sign in with your email and password.
An alternative to email registration is signing in with Google. The Continue with Google button starts an OAuth flow with PKCE: you are redirected to Google's consent screen, then back to /auth/callback, and the token exchange happens behind the scenes. For the user this is a single click that lands them straight on /dashboard, with no separate activation step.
After a successful sign-in the access token is kept in the app's memory, while the refresh token is stored in an httpOnly Secure cookie. There is more on this in the "Account security" section.
First run: the Setup Wizard
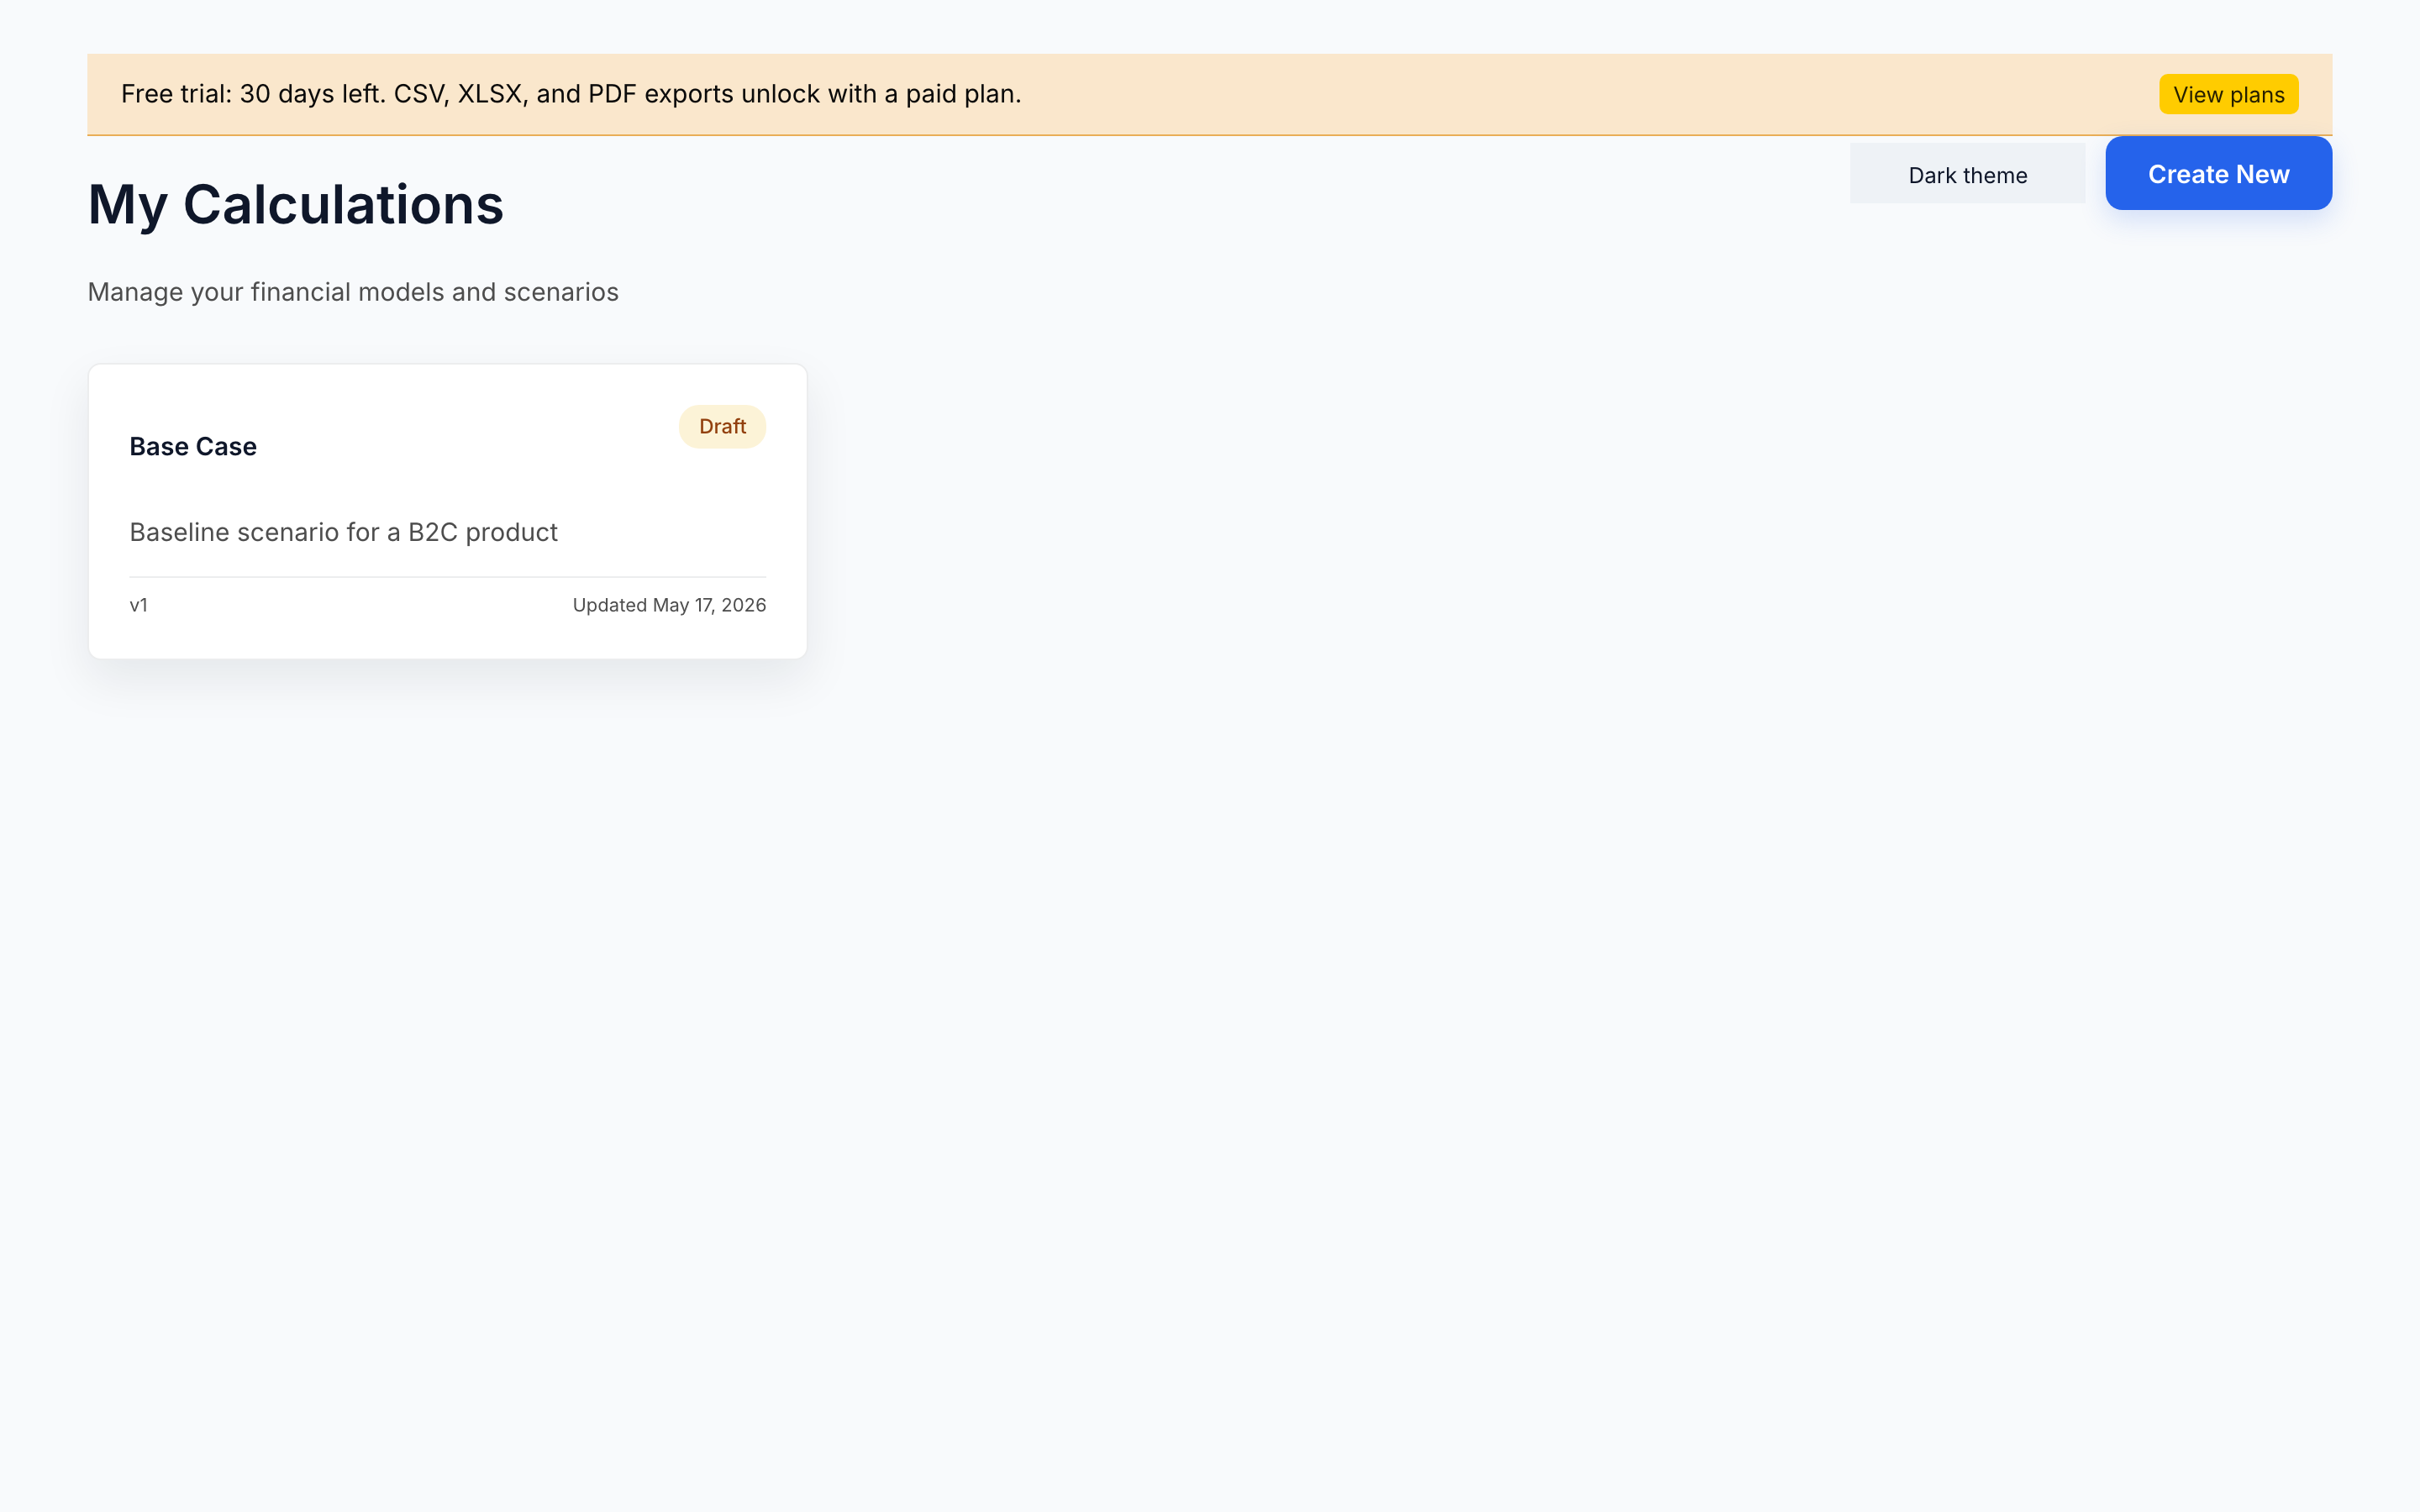
Right after signing in you land on /dashboard—the "My Calculations" screen. If you have no models yet, click Create First Calculation (or Create New in the top-right corner). The service creates a new model from the default scenario and opens the /calculation/:id editor.
When the editor opens for the first time, the Setup Wizard modal expands automatically (you can also reopen it with the Setup wizard button in the top bar). The wizard has three steps:
- Project overview — the scenario name (Scenario name), a short description (Description), and the calculation currency (Calculation currency). USD, EUR, and RUB are available; the currency determines number formatting and the symbol.
- Core settings — the model horizon in months (from 12 to 120), the launch year and month (Launch year and Launch month), the discount rate (Discount rate, in percent per year), and the seasonality toggle (Enable seasonality by default).
- Taxes — corporate income tax (Corporate income tax), the VAT rate (VAT rate), payroll social tax (Payroll social tax), and the VAT included in price flag.
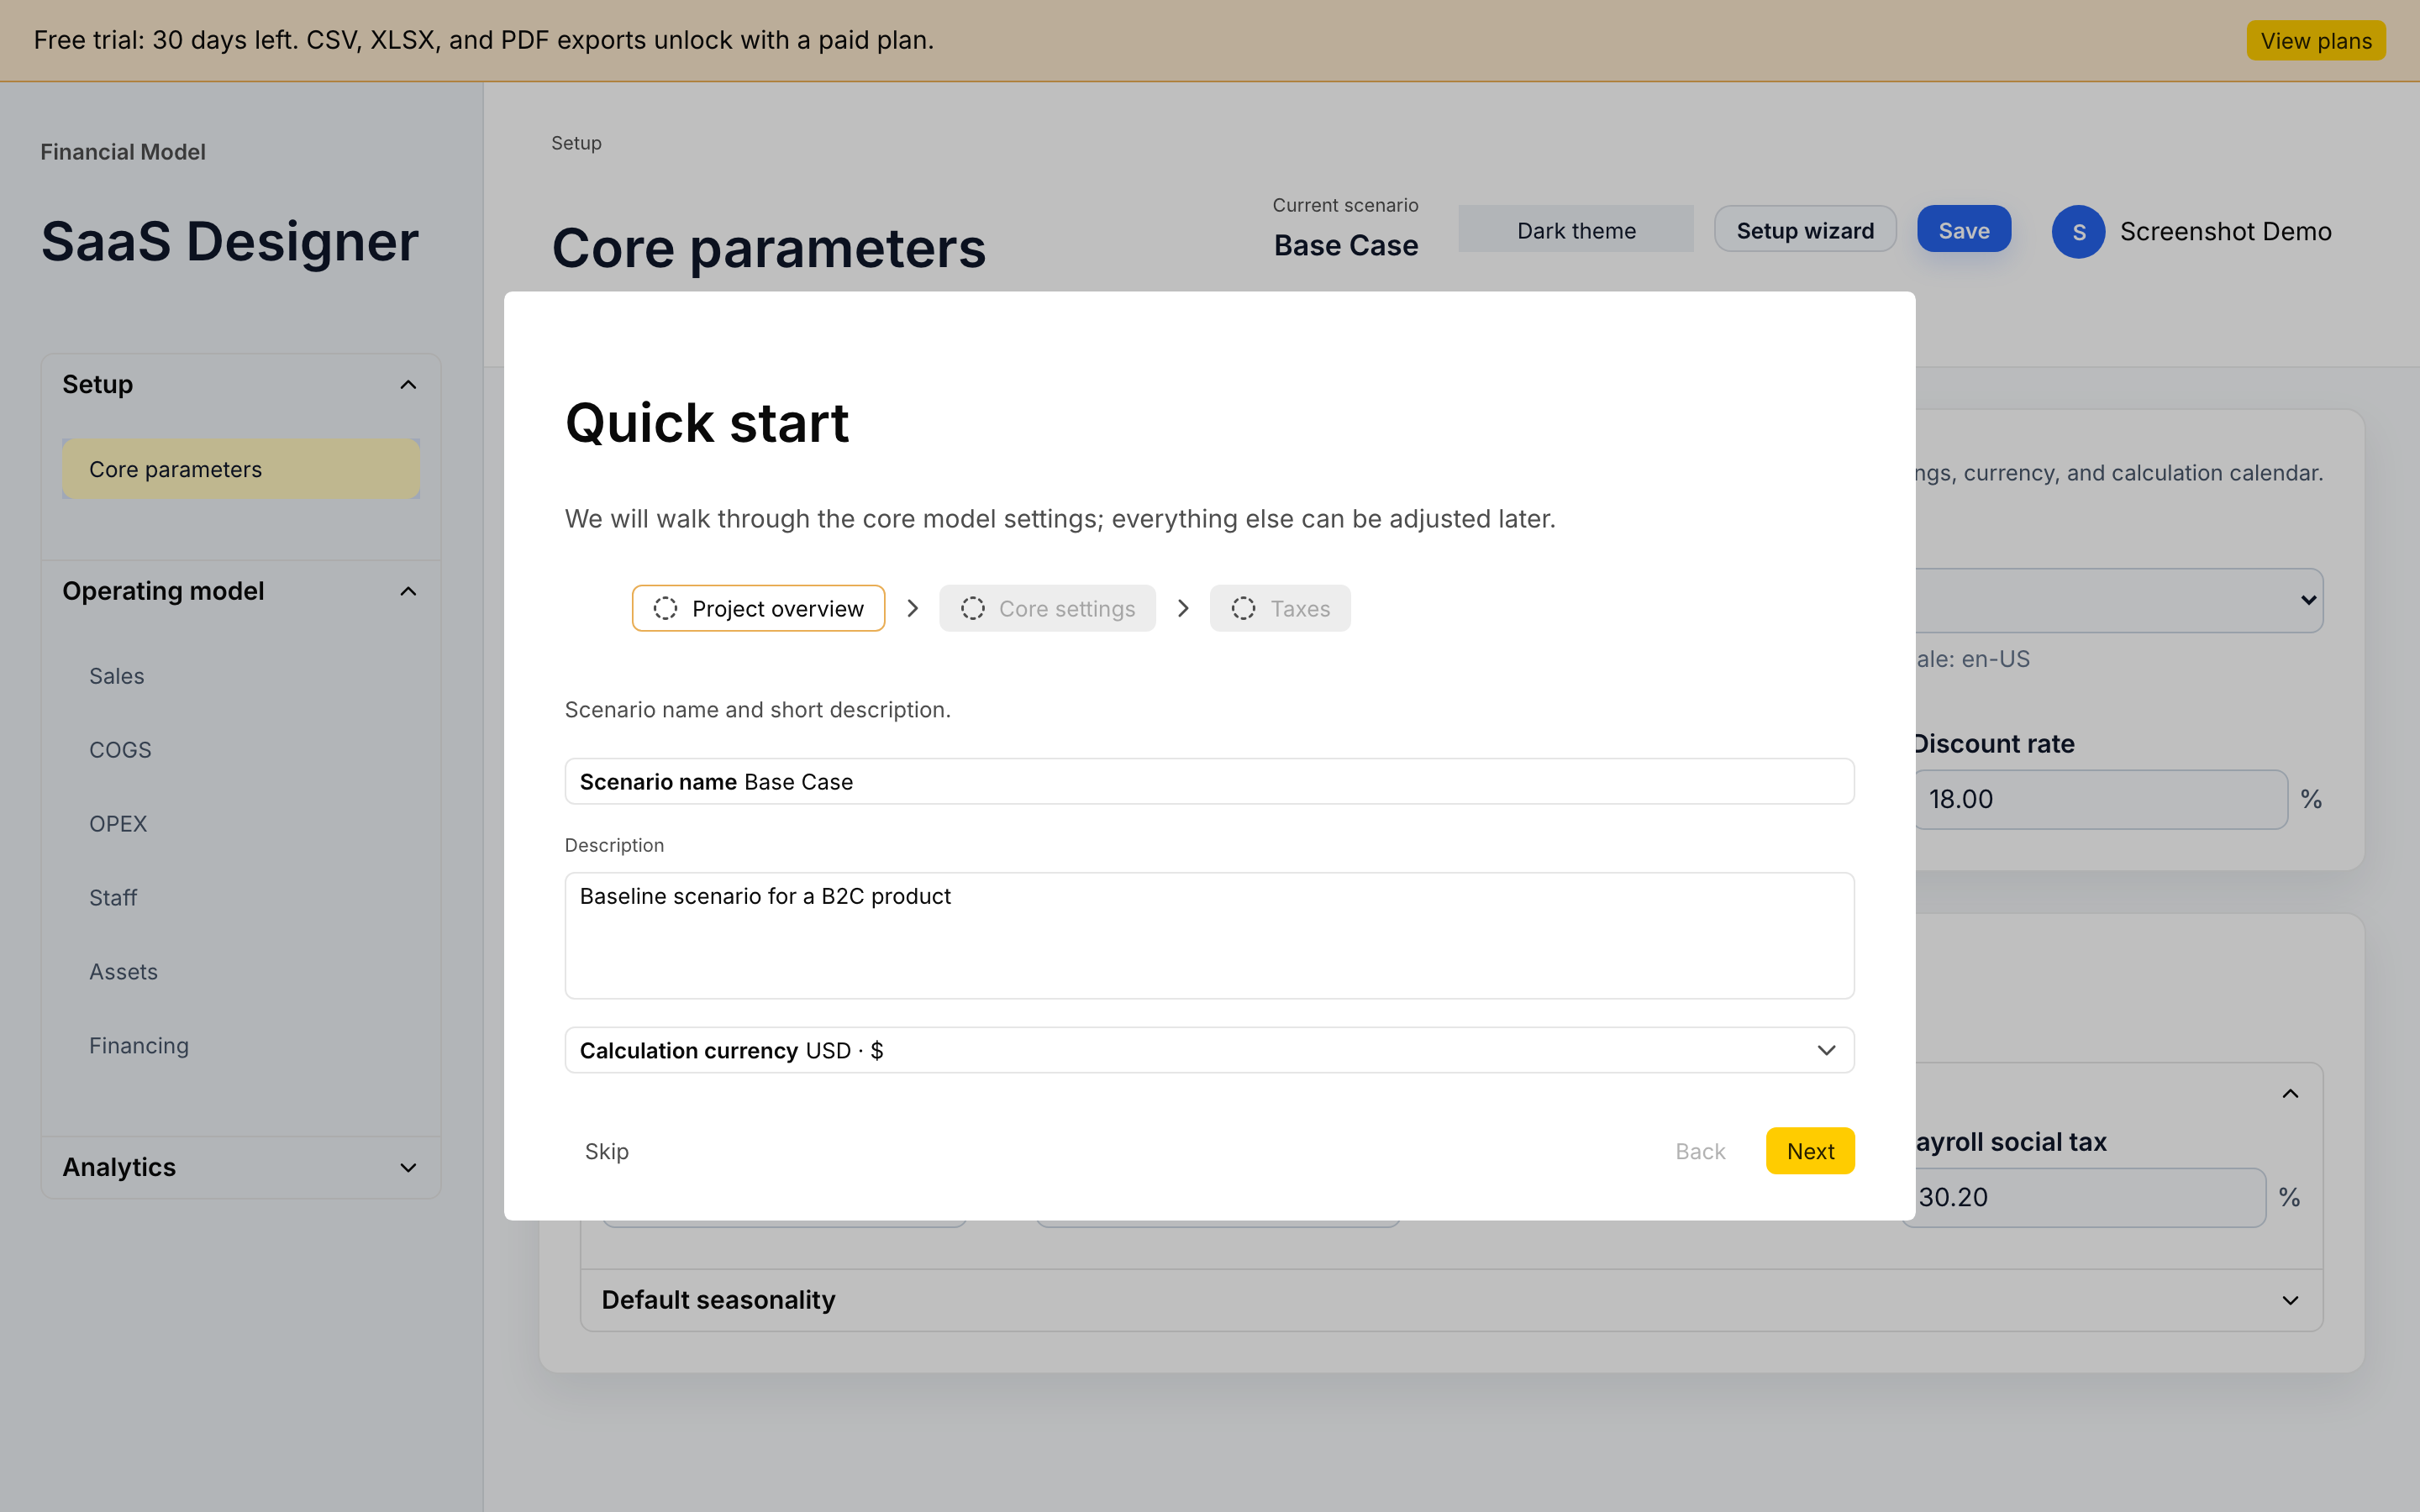
All of these values can be changed later—just reopen the Setup Wizard—but the base currency, horizon, and start date drive how the timeline is built, so it is worth setting them up front. If you decide to skip the wizard, click Skip; the product records that you went through it in localStorage and will not open it automatically again.
The scenario and domain model
In CashQuil the entire model is a single Scenario object. It lives in Zustand state with undo/redo support and is auto-saved in the browser; when connected to the backend it syncs to PostgreSQL. The scenario consists of several blocks, and each one maps to its own page in the editor's left panel.
| Section | What it describes | Where to edit it |
|---|---|---|
assumptions | Global settings: currency, horizon, tax rates, discount | Setup Wizard and the Core parameters page |
sales | Traffic sources, tariffs, conversion funnels, retention profiles, micro-transactions | Sales |
cogs | Cost of goods sold: per-user, per-transaction, % of revenue, fixed lines | COGS |
opex | Operating expenses by category: marketing, R&D, G&A, sales, support, other | OPEX |
staff | Hiring plan by role: headcount, salary, bonus, payroll tax | Staff |
assets | CAPEX items with depreciation | Assets |
financing | Debt schedule (annuity or equal principal) and equity injections | Financing |
In the left panel the sections are grouped into three accordions: Setup, Operating model, and Analytics. At the top sit the name of the current scenario and the Save button, which sends the model to the backend and creates a new version.
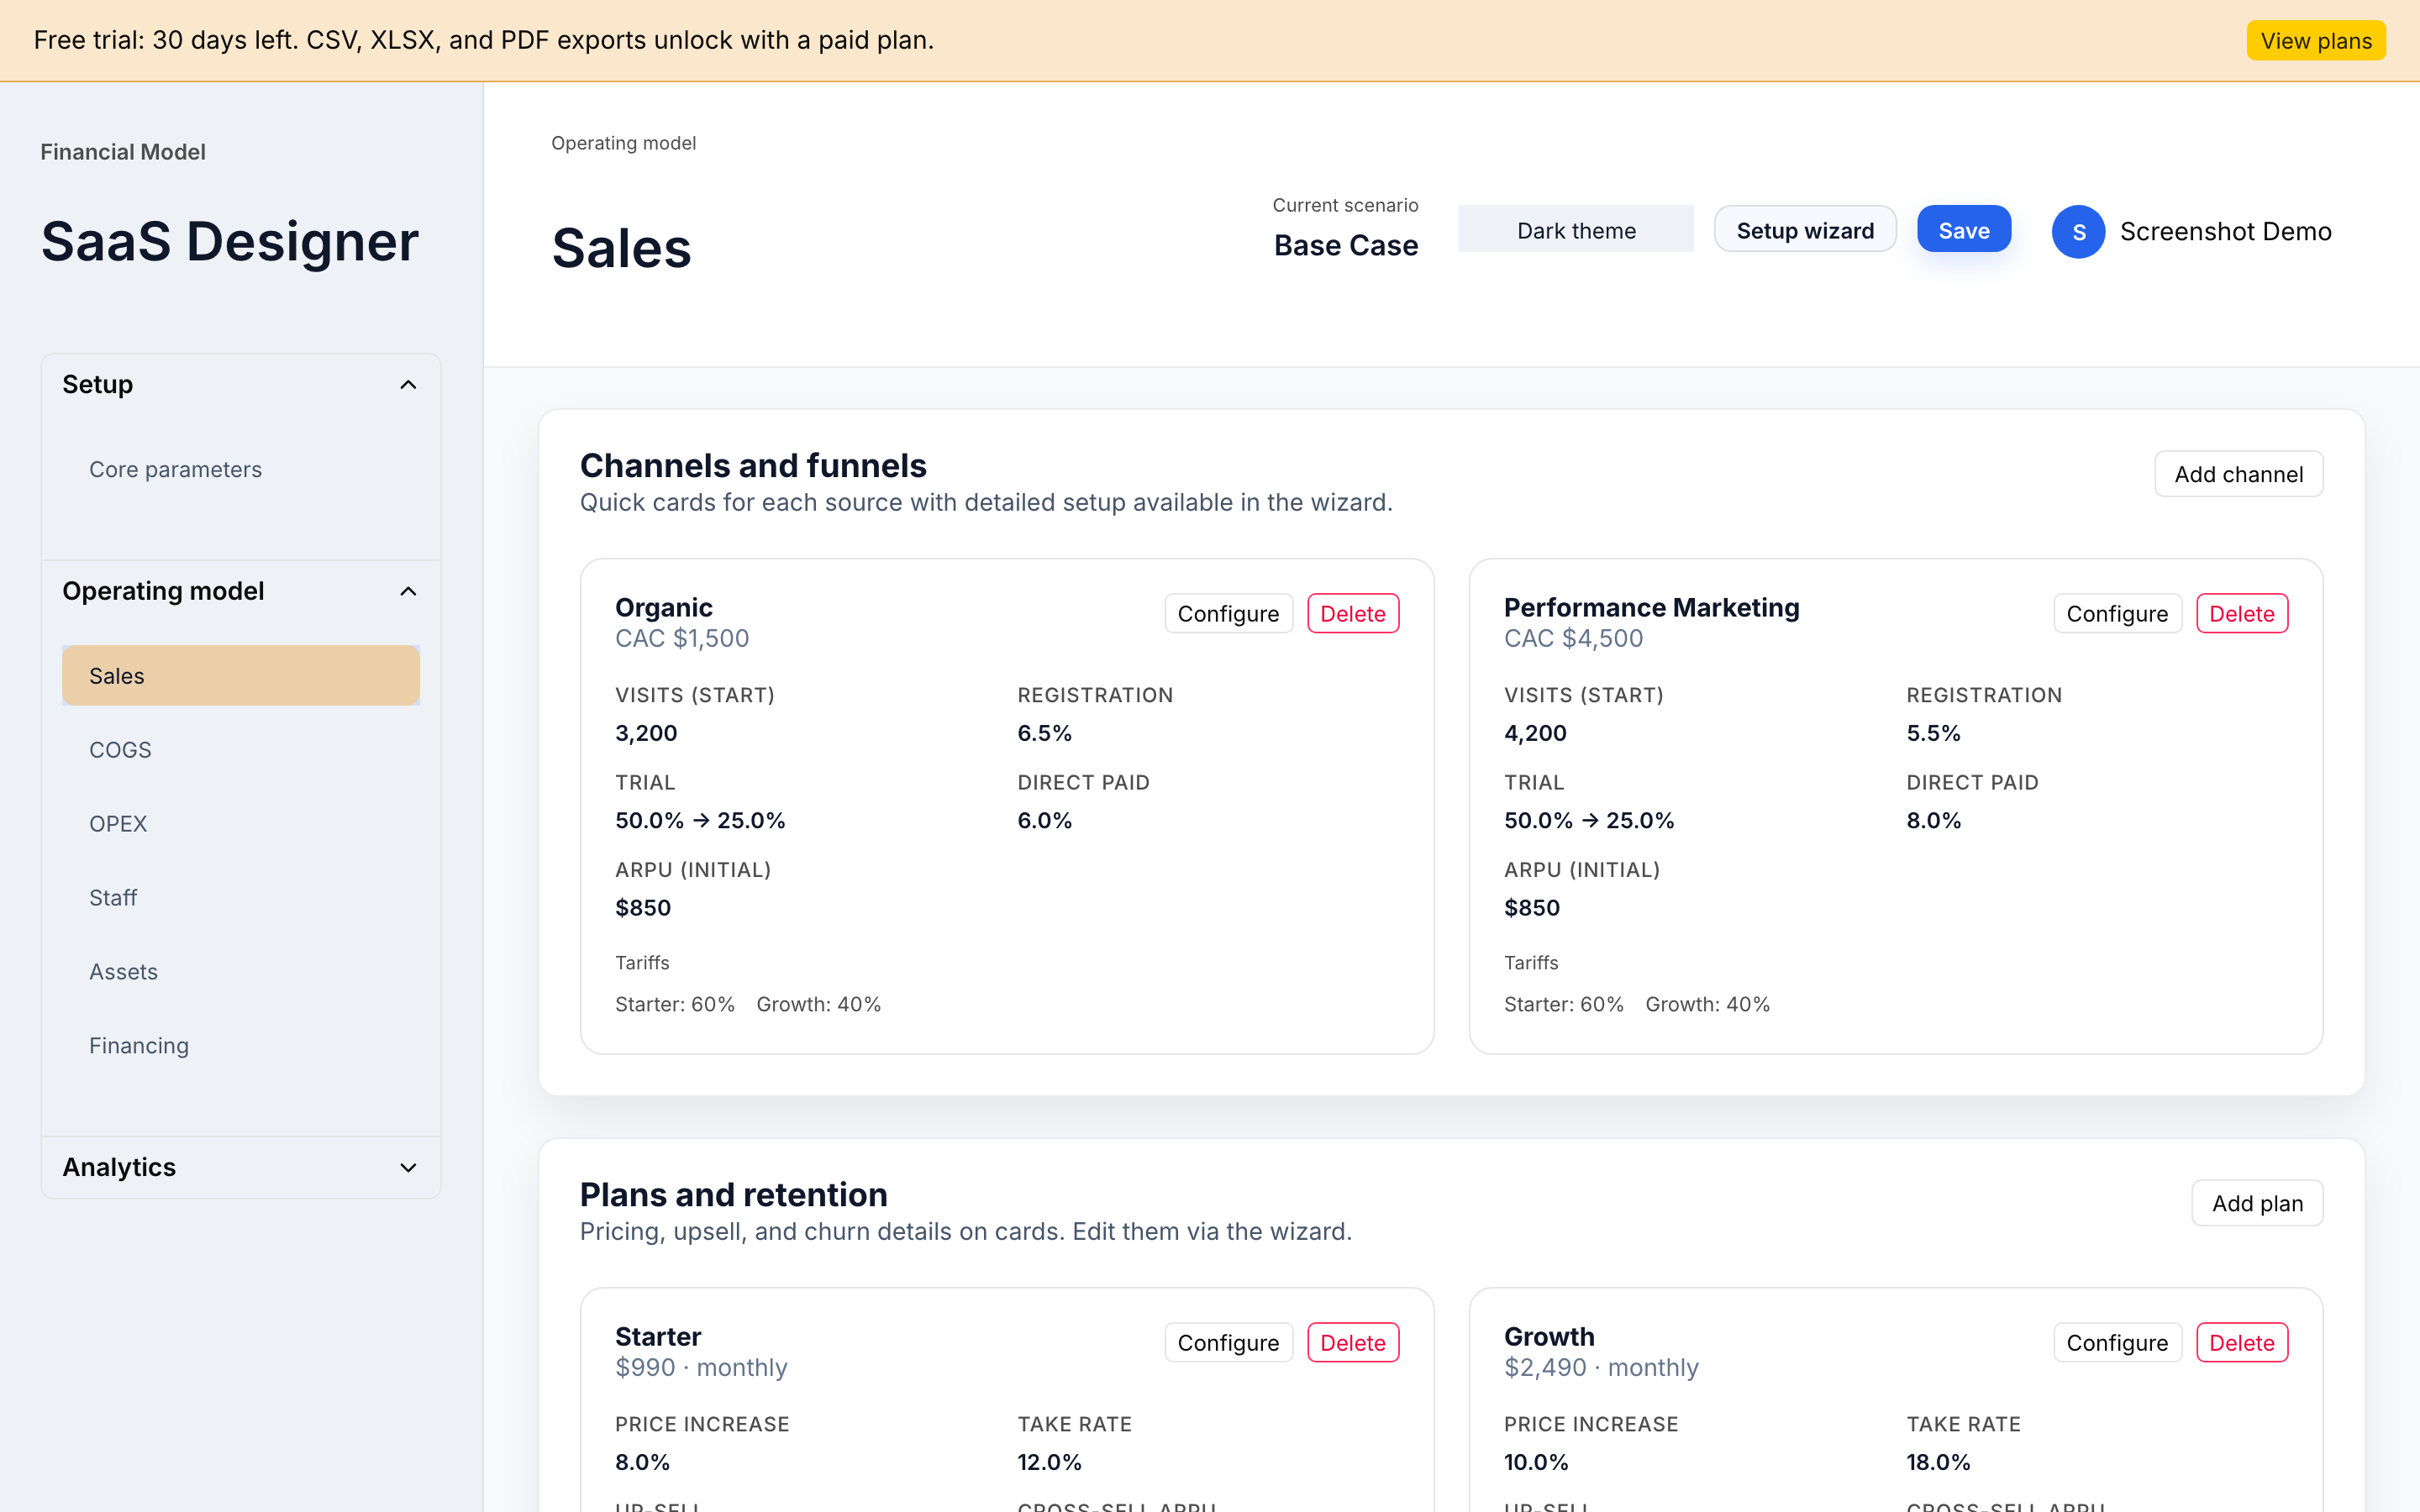
The key idea: you work with drivers, not with cell values. In Sales, for example, each channel is defined by monthly series: number of visits, conversion to registration, trial share, trial-to-paid conversion, refund rate, ARPU, and ARPPU. From these series the engine itself builds the funnel and the number of new paying users for each tariff.
Calculations and metrics
Under the hood CashQuil runs a pure functional pipeline (src/calculations). All monetary values are stored in minor units (cents, kopeks)—this protects the calculations from floating-point errors. The pipeline has four stages.
1. Funnel and retention (funnel, retention)
From the monthly traffic and conversion series the funnel is computed: visits → registrations → trial → conversion to paying → refunds → net new paying users. A cohort retention model then works out how many users from each cohort remain active in each subsequent month, accounting for monthly churn, reactivation rate, expansion, and downgrade.
2. Revenue (revenue)
Each tariff's price is normalized to a monthly amount (for quarterly and annual billing cycles the price is split). MRR is then computed as active paying users × monthly price, expansion revenue is added (a share of MRR), and—when the flag is enabled—micro-transaction revenue (takeRate × average number of transactions × average ticket), with refunds subtracted. The output is grossRevenueMinor and netRevenueMinor.
In parallel, unit economics is computed for each traffic channel:
- CAC — entered by the user on the traffic source card.
- LTV — approximated as average ARPU / average monthly churn for the selected channel, accounting for the tariff mix (if churn is zero, average ARPU × horizon is used).
- Payback months —
ceil(CAC / average ARPU).
These are quick, indicative figures for dashboards; for serious pricing decisions it is worth also looking at the cohort retention chart.
3. Costs (costs)
A single module aggregates:
- COGS — four line types: per active user, per transaction, % of revenue, and fixed. Support can optionally be enabled with the
contactRateandcostPerTicketparameters. - OPEX — expense lines by category, with the option to set a growth plan.
- Staff — for each role the figure is
headcount × salary × (1 + bonusRate) × (1 + payrollTaxRate). - Depreciation and CAPEX — straight-line depreciation of assets, accounting for useful life and residual value.
- Financing — interest and principal for the annuity schedule and the equal-principal schedule, accounting for the grace period and fees; equity injections are handled separately.
4. Financial statements and metrics (financials, utils)
From revenue and costs the P&L is built:
Revenue → Gross Profit → EBITDA → EBIT → EBT → Net Income
Income tax is charged only on positive EBT. Cash flow is assembled from three parts: operating (EBITDA − tax), investing (−CAPEX), and financing (equity + debt draw − principal − fees − interest). The accumulated cash balance is available both monthly and by year.
The investment metrics are computed from the cash flows:
- NPV — the sum of discounted cash flows at a monthly rate of
(1 + r)^(1/12) − 1. - IRR — found with Newton's method; it returns
nullif it does not converge within 100 iterations or if there is no sign change. - Profitability Index (PI) — the ratio of the present value of future flows to the size of the initial investment.
- Payback period (PP) — the index of the first month in which the cumulative undiscounted flow becomes non-negative.
- Discounted Payback (DPP) — the same, but for discounted flows.
You will see these values as KPI cards on the Summary page.
Reports and charts
The Analytics section in the left panel contains three screens.
Reports
The Reports page shows three tables:
- Profit and Loss (P&L) report — Revenue, COGS, Gross profit, OPEX, Staff, EBITDA, Depreciation, EBIT, Interest, EBT, Income tax, Net income.
- Cash flow statement — operating, investing, and financing flows, the net flow, and the cash balance.
- Taxes — income tax and the effective VAT rate by month.
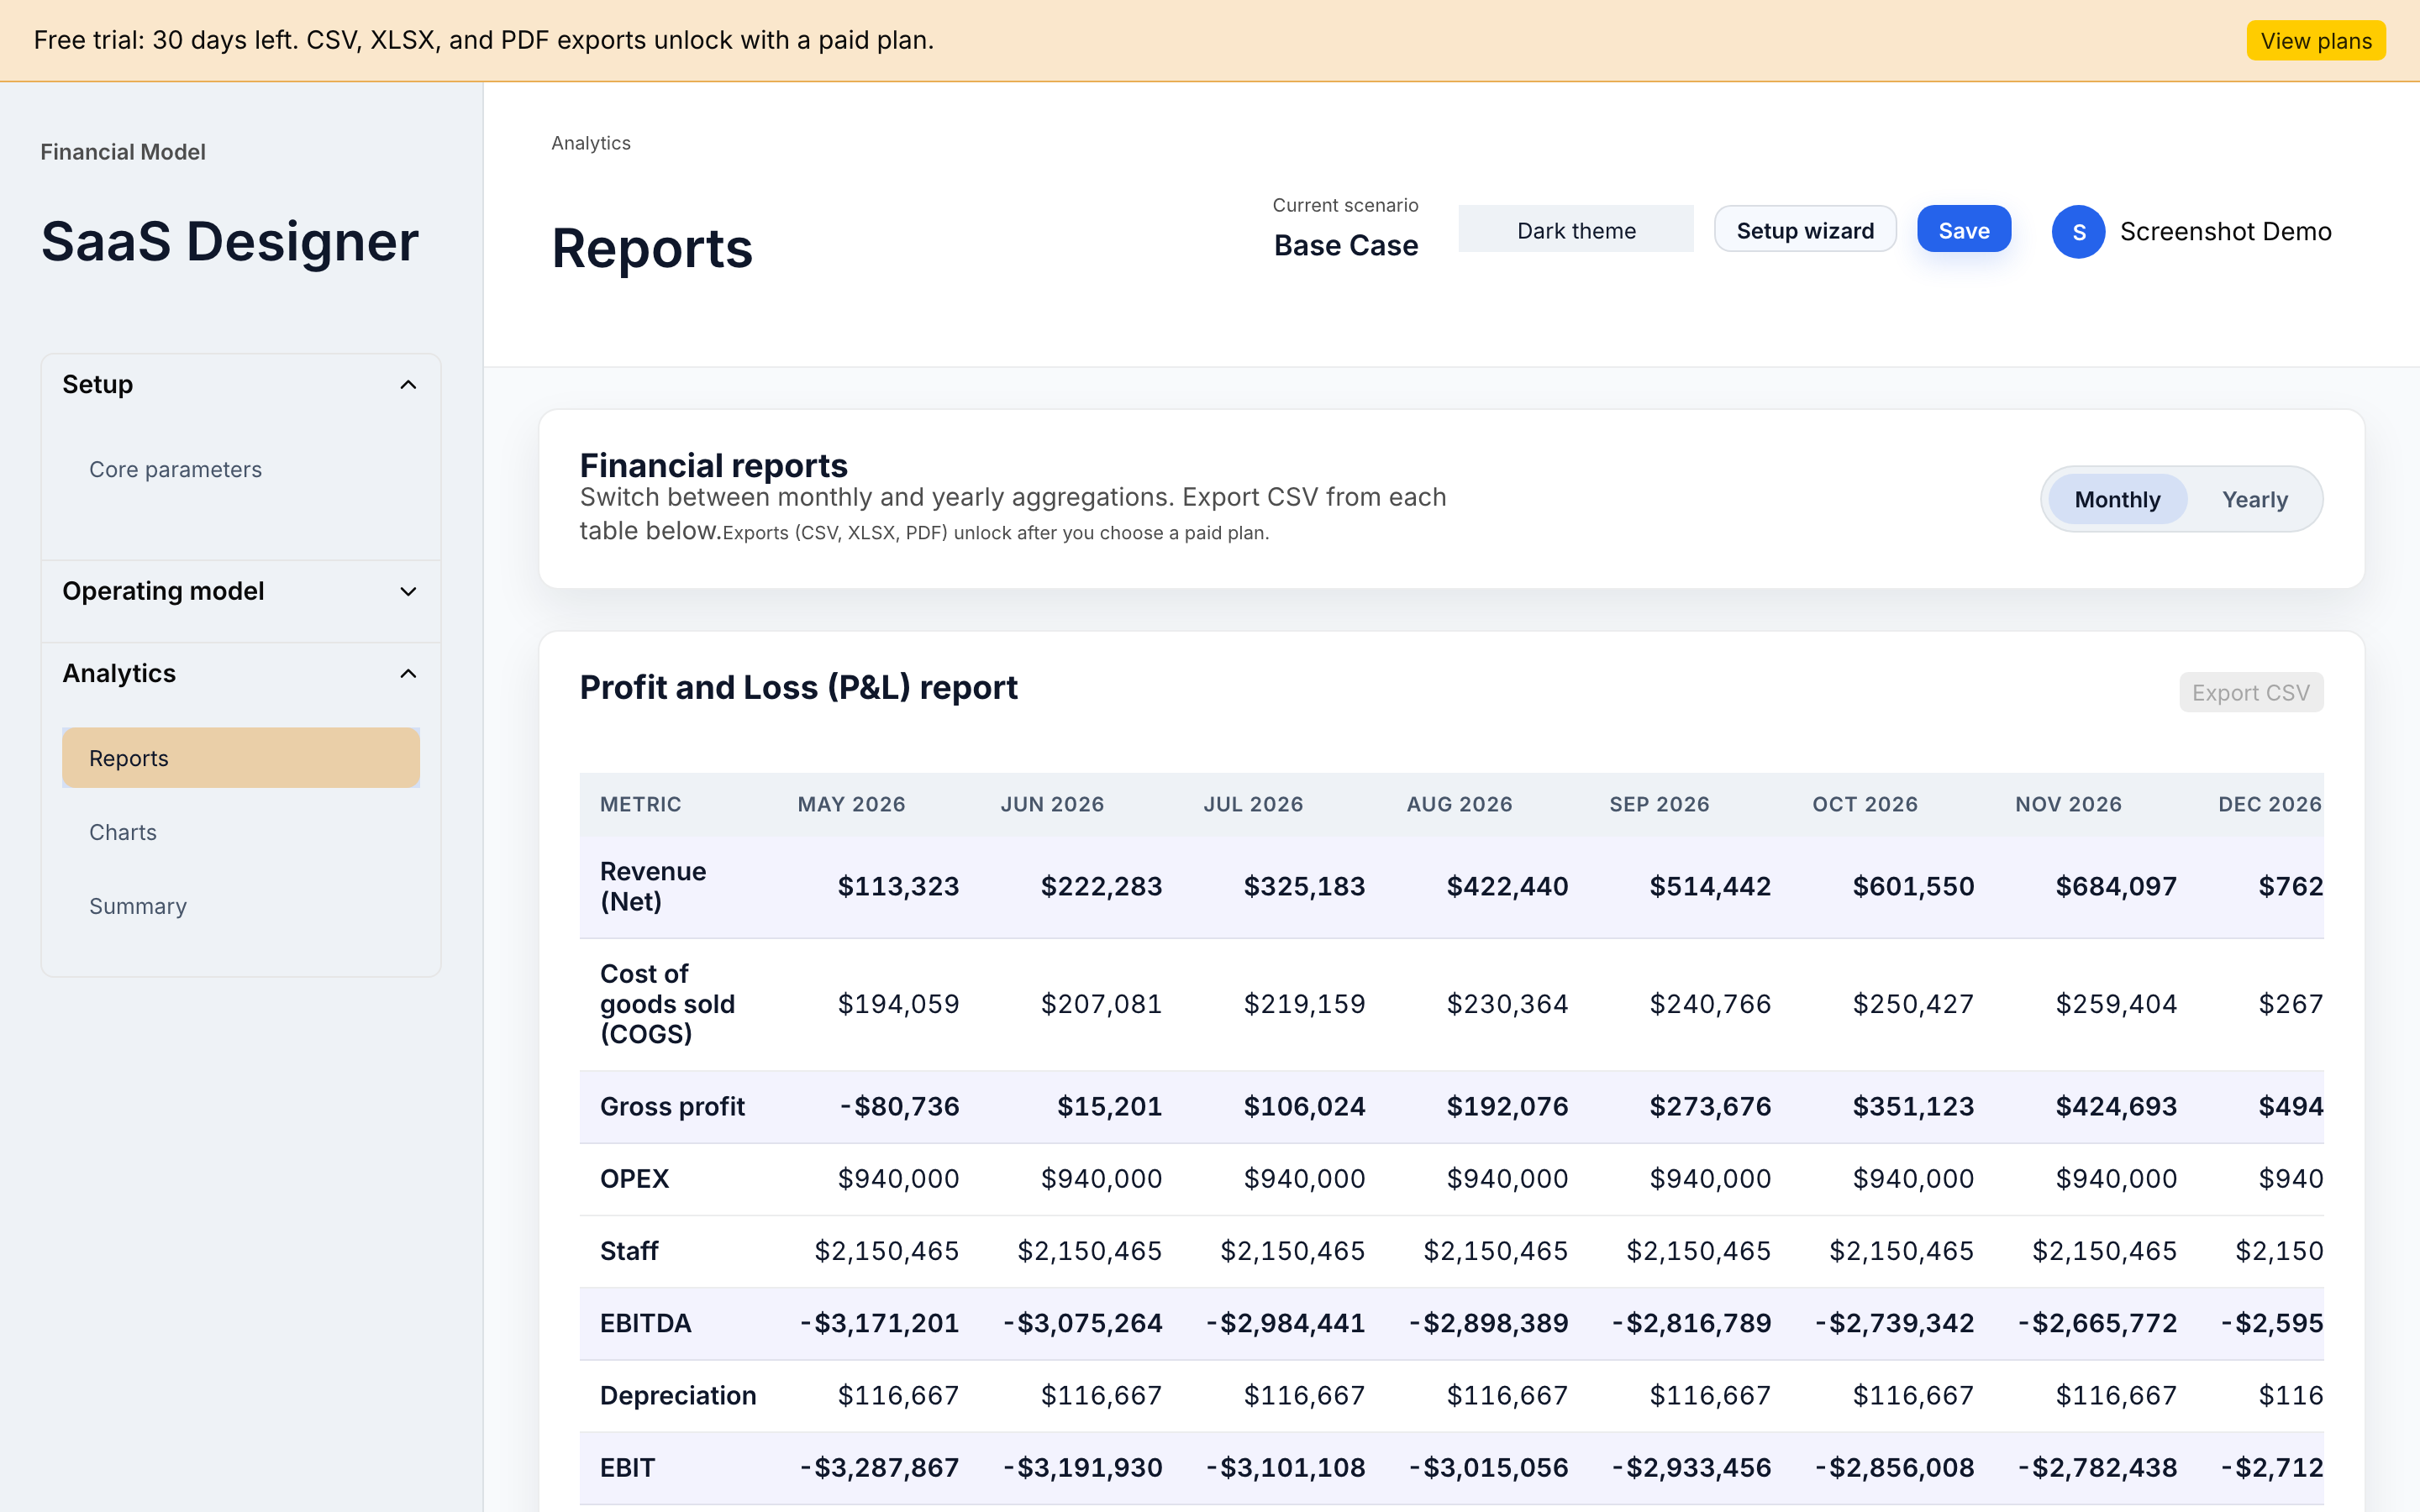
The Monthly / Yearly toggle in the top-right corner changes the aggregation. Each table has an Export CSV button—if export is available on your current plan, the file downloads right away.
Charts
The Charts page gives a visual summary. By default it opens in yearly mode:
- A line chart, Revenue vs EBITDA by year.
- A bar chart, Net cash flow by year—clicking a bar drills down into the monthly breakdown for the selected year.
- Year-over-year highlights cards: revenue, EBITDA, net cash flow, ending cash, and active users at year-end.
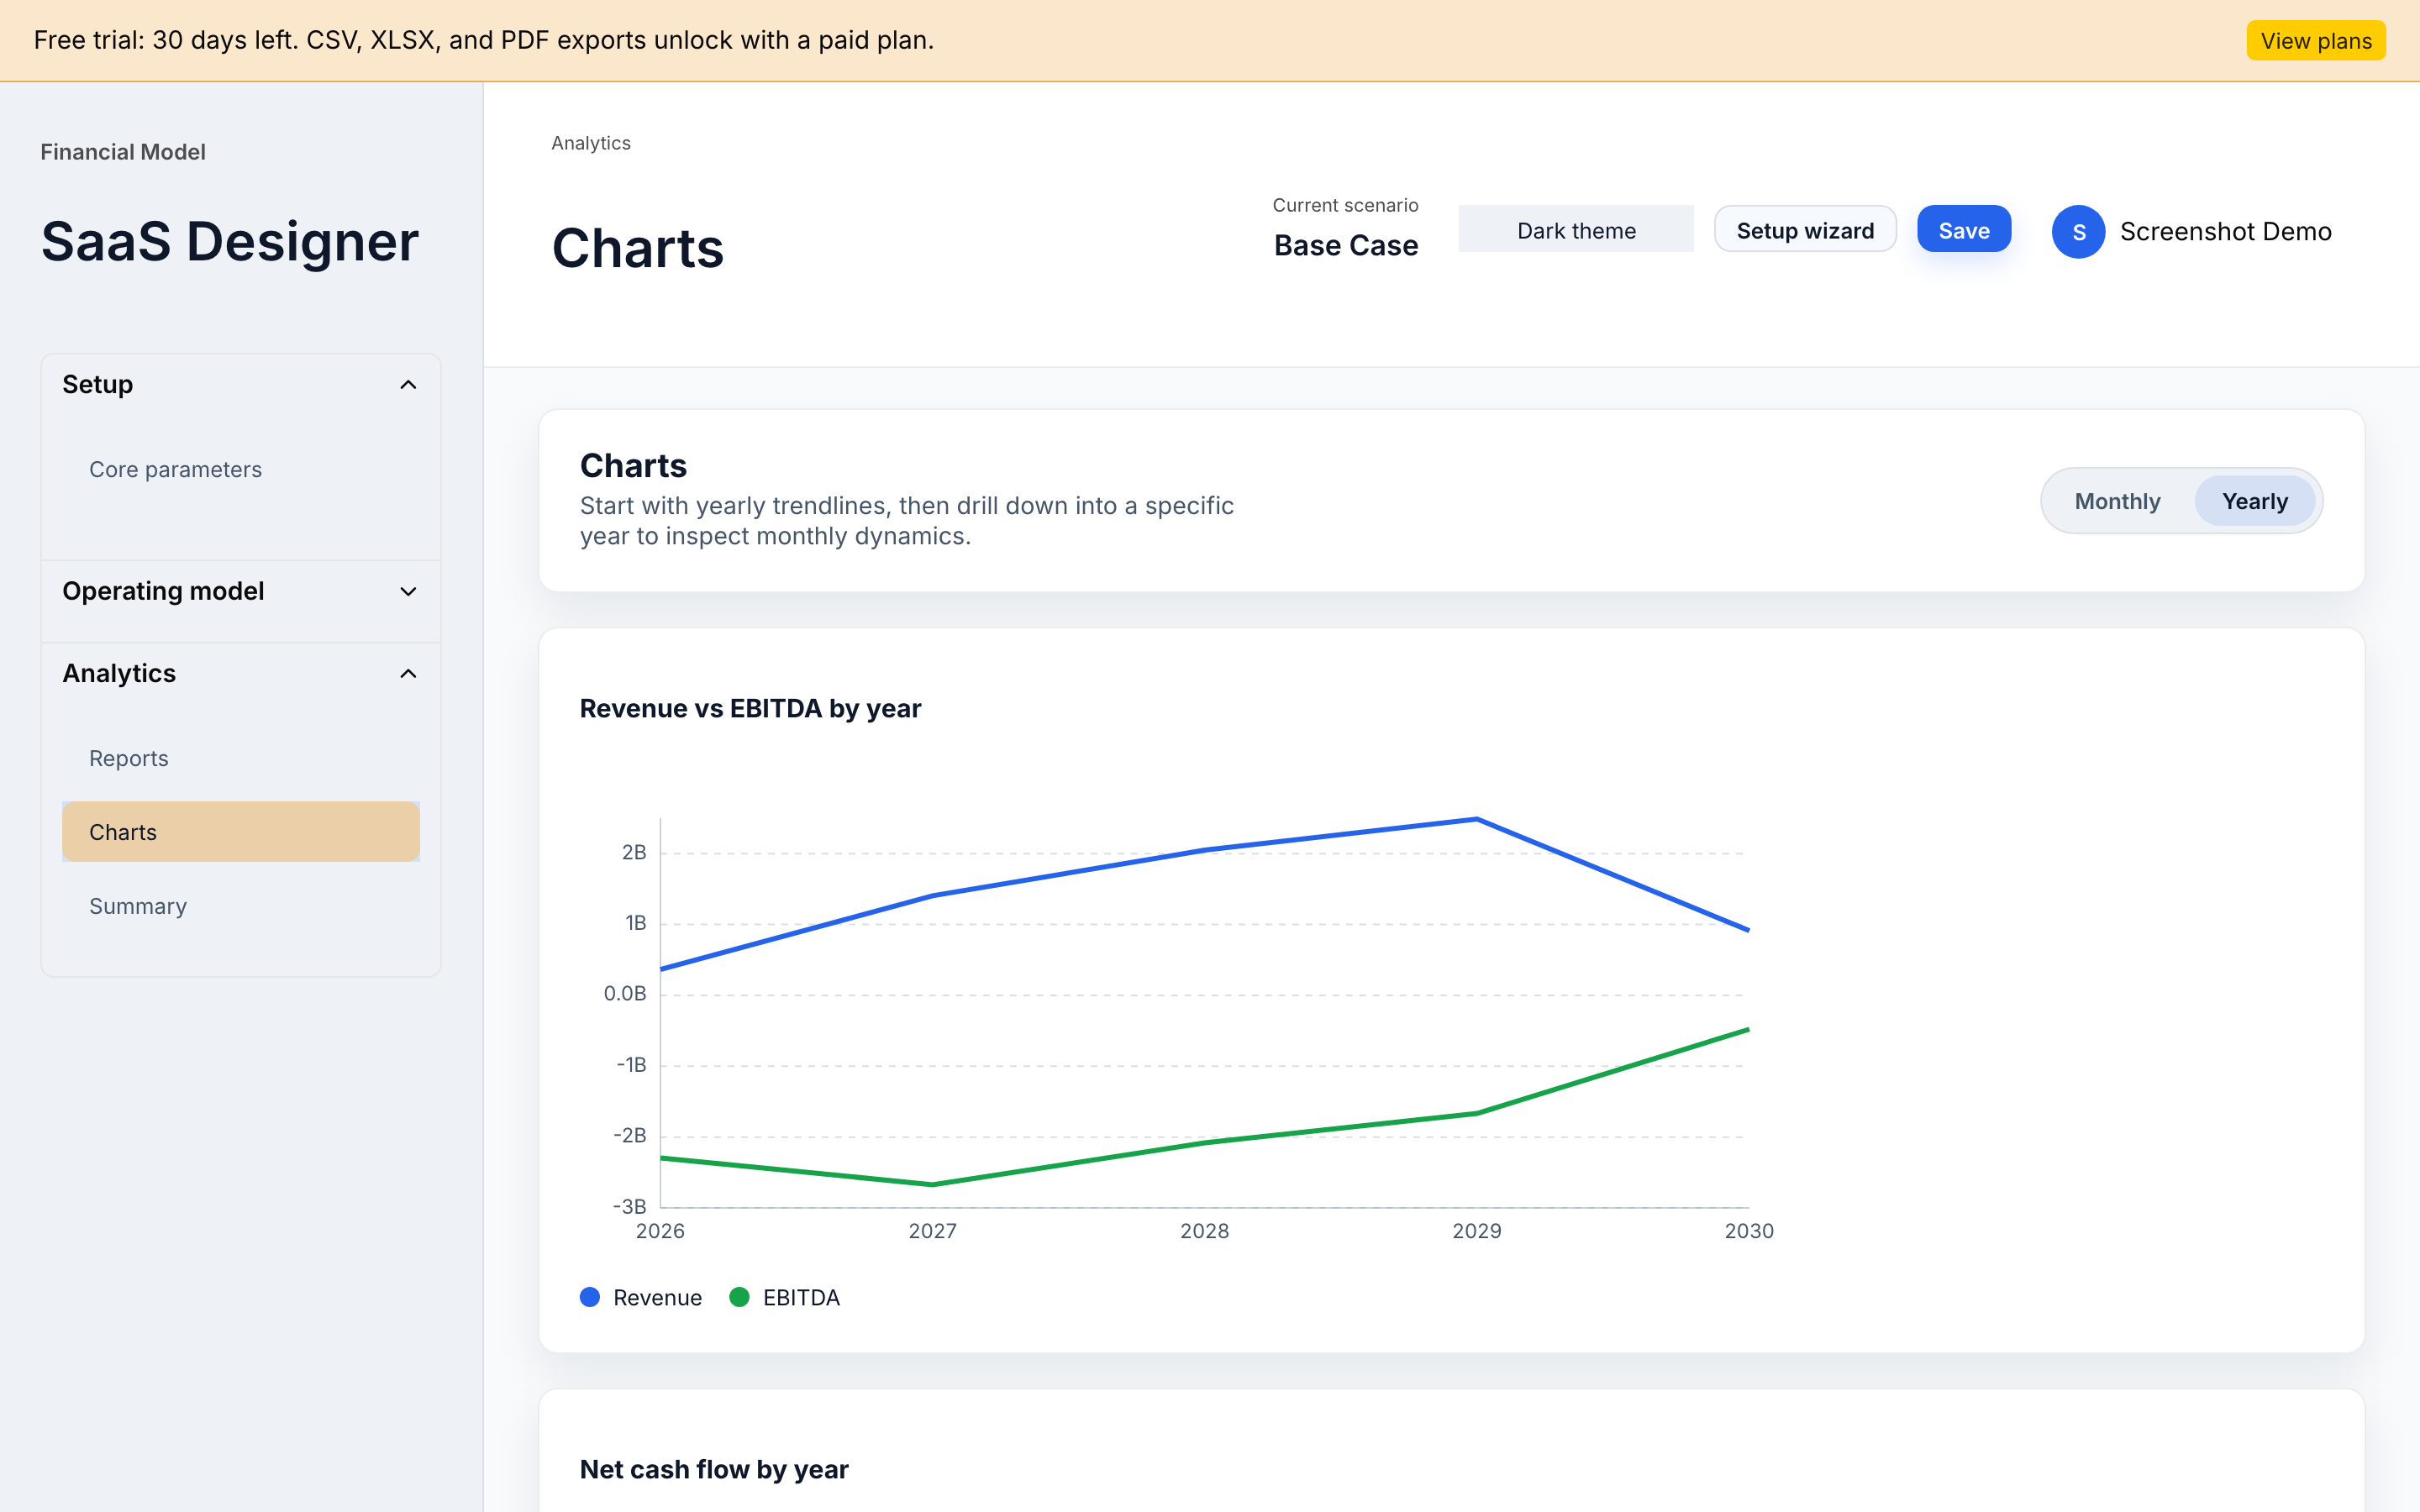
Switching to Monthly mode opens the month-by-month charts for Revenue/EBITDA, Cash balance, Net cash flow, and Active paying users.
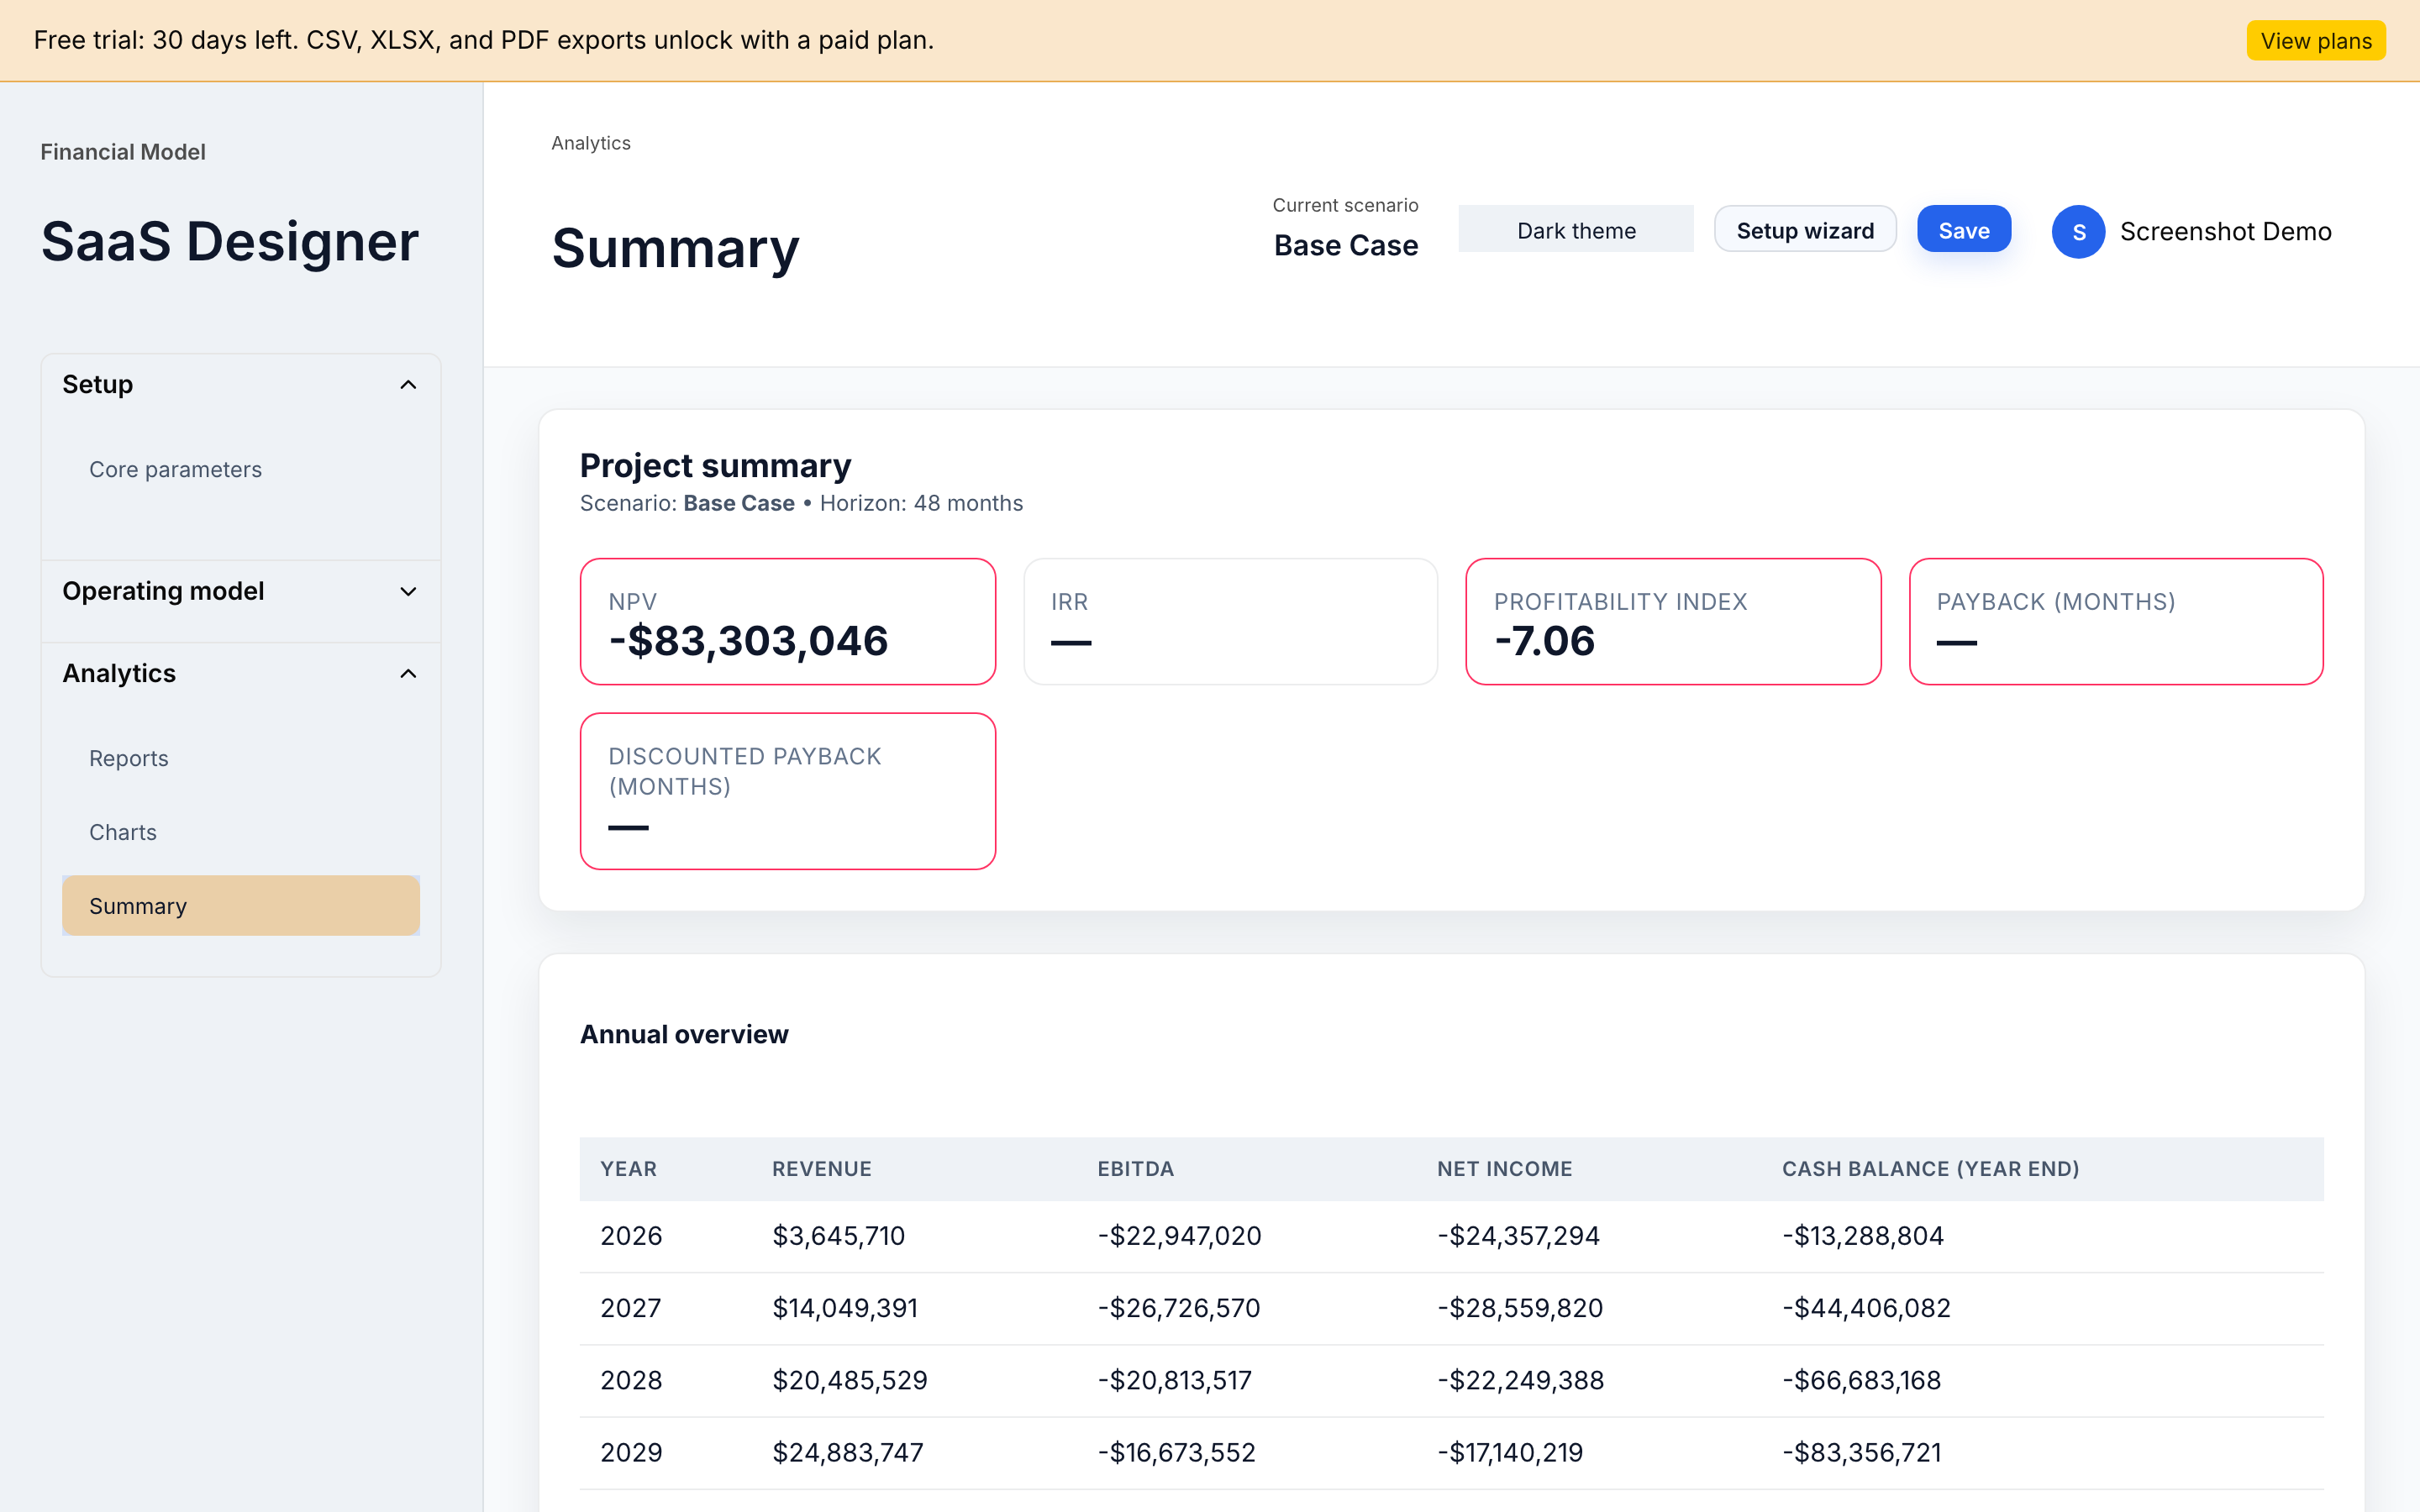
Summary
The Summary page is the model's cover sheet. At the top are KPI cards with NPV, IRR, Profitability Index, Payback, and Discounted Payback (in months). Below them is an annual table with revenue, EBITDA, net income, and the cash balance at year-end. It is a convenient place to start a discussion of the model with an investor: the numbers are visible at once, without having to wade through the P&L line by line.
Export
Export is available from the Reports section—the Export CSV button under each table. The backend returns an exports object inside entitlements with three flags:
csv— a text export of each P&L, Cash flow, and Taxes table.xlsx— an Excel export (available on the higher plans).pdf— a printable version of the report.
If export is not available on your plan, the button stays disabled with a hint: "Exports (CSV, XLSX, PDF) unlock after you choose a paid plan" during the trial, or "Your free trial has ended. Choose a plan to export and edit models" after it ends.
Plans and billing
CashQuil is sold on two plans, both with a built-in 3-day trial.
| Lite | Pro | |
|---|---|---|
| Projects | 1 | up to 5 |
| Model horizon | 24 months | 48 months |
| Scenarios | 1 | unlimited |
| Modules | Sales, COGS, OPEX, Staff | + Assets and Financing |
| Richer analytics | — | Sensitivity, cohorts |
| Export | PDF, CSV | + XLSX |
| Support | priority | |
| Price (as of publication) | from $25/mo | from $60/mo |
In addition to the subscriptions there are two one-off payments:
- Expert review ($350) — a 45-minute review of your model by an expert, with a written report.
- One-off model ($75 per project) — a custom model for a single project, without a subscription.
Checkout is handled through Stripe Checkout. When you click Start free (3 days) or Buy now in the Pricing block on the landing page, the frontend calls billing/checkout/create-session and passes a plan_id (for example, pro_monthly, lite_yearly, expert_review). Importantly, plans are now selected by plan_id, which is checked against an allowlist on the server. The trial length, the mode (subscription or payment), and the real Stripe price ID are all resolved on the backend; the client does not pick a Stripe price directly. This eliminates a whole class of errors where a stale price accidentally ends up in the URL.
After payment Stripe returns the user to /dashboard?checkout=success&session_id=.... The backend updates the subscription status and entitlements via a webhook, after which limits and export are unlocked automatically. You can cancel the subscription at any time: access is kept until the end of the paid period, with no penalty fees.
Account security
Account security deserves a separate mention—it is a new and important part of the platform. Here is what is in place:
- Refresh tokens are not in JS. After login the backend sets the refresh token in an httpOnly Secure cookie with the SameSite=strict attribute. There is not a single line in the frontend code that reads the refresh token—it is physically inaccessible to XSS injections.
- Rotation on every refresh. On each
/sessions/refreshrequest the old session is marked revoked, a new refresh token is issued, and the cookie is updated. There is no window in which an attacker can use the same refresh token twice. - Kill-switch on compromise. If someone tries to reuse an already-revoked refresh token (a classic sign of theft), the backend automatically revokes all of that user's active sessions. In parallel, the fingerprint (IP + User-Agent) is checked—a mismatch also revokes the session.
- Hashing in the database. The database stores an HMAC hash of the refresh token, not the token itself. A leaked database dump does not let anyone forge sessions.
- Logout from every device. The backend has a dedicated
/sessions/logout-allendpoint that revokes all of a user's active sessions. It is used as a manual kill-switch when there is a suspicion that access has been taken over.
In the UI, the ordinary Sign Out in the profile menu performs a best-effort logout and clears local state. If you lose a device, contact support to run a full logout-all.
Common issues and FAQ
- The activation email did not arrive. First, check your spam folder and allowlist the sender's domain. Second, request a new email through the resend-activation endpoint (supported on the backend).
- Forgot your password. The current UI has no "Forgot password" button—contact support to reset the password manually.
- How to change the currency. Open the Setup Wizard with the button in the top bar and change Calculation currency to the option you need. Monetary values inside the scenario are not recomputed, but all formatting (symbol, locale) changes immediately.
- Plan limits reached. If you hit the project limit (1 on Lite, 5 on Pro) or the horizon limit (24/48 months), upgrade to Pro in the Pricing block on the landing page. No data migration is needed: the limits are lifted after a successful payment.
- The Save button shows an error. The most common cause is an expired session. Try signing in again; if the error persists, check that you are not in read-only mode (in that case the Save button is disabled and a trial banner appears).
- The trial ended and no plan was chosen. The account switches to read-only: models are kept, export is disabled, and editing is blocked. To restore access, choose a plan and complete checkout.
What's next
If you have just signed up, a reasonable order of actions looks like this:
- Finish the Setup Wizard—set the currency, horizon, and taxes so that the timeline is correct from the very first recalculation.
- Go to Sales and describe at least one traffic channel and one tariff. That is already enough for the engine to build revenue and MRR.
- Fill in COGS, OPEX, and Staff at the level of a few key lines—the model will immediately show a sensible EBITDA.
- Open Summary and look at NPV, IRR, and payback. If IRR is
null, the flows are one-sided—try adding debt or equity in Financing. - Save the model with the Save button, create a second scenario (unlimited on the Pro plan), and compare them in Charts.
Additional material on models and metrics is available in the blog—it covers LTV, CAC, NPV/IRR, and how a 24–36-month SaaS model is built. When you are ready, start the 3-day free trial and build your first model.
Frequently asked questions
The activation email never arrived. What should I do?
First check your spam folder and allowlist the sender domain. If it still does not arrive, you can trigger a new message through the backend resend-activation endpoint, which the UI exposes when applicable.
How do I change the project currency after the model is created?
Open the Setup Wizard from the top bar and change Calculation currency to USD, EUR, or RUB. Stored amounts are kept in minor units and are not recomputed, but all formatting—symbol and locale—updates immediately.
How is Lite different from Pro?
Lite covers one project, a 24-month horizon, a single scenario, and the Sales, COGS, OPEX, and Staff modules, with PDF and CSV export. Pro raises the limits to five projects and 48 months, adds unlimited scenarios, the Assets and Financing modules, XLSX export, richer analytics, and priority support.
What happens when the trial ends?
If no paid plan has been chosen, the account switches to read-only: your models are kept, but editing and export stay disabled until you complete checkout for a plan.
Is it safe to keep my models in CashQuil?
Refresh tokens live in an httpOnly Secure cookie with SameSite=strict, rotate on every refresh, and are stored only as an HMAC hash. Reusing a revoked refresh token triggers a backend kill-switch that revokes the user's active sessions—protection against token theft.